 |
ASTR306 |
| Home |
| Observations |
| Data Reduction |
| Data Analysis |
| Results |
| Credits |
Results
DY Peg
The V band and R band light curves are given below. The gaps in the light curves indicate times when the exposure sequence was stopped to realign the telescope. In the V filter, DY Peg varied in luminosity 0.7 magnitudes with a period of 0.0726 days, which agrees with the period given by the General Catalog of Variable Stars to within 0.4 percent. In the R filter, DY Peg varied in luminosity 0.6 magnitudes. In addition, by comparing DY Peg's light curve to the light curves of the comparison stars, one can see that any deviations in DY Peg's light curve were clearly caused by atmospheric flucuations as the deviations are seen in all four light curves. Although the R and V filter light curves appear to have similar periods and phases, the shape of the curves is very different. V-band light curve for DY Peg
 R-band light curve for DY Peg
The V-R curve is given below. It varied from (V-R)=0.5 to (V-R)=0.26. Again many of the deviations in the DY Peg color curve can be explained by noting the atmospheric fluctuations present in the color curves of all four stars. The period obtained here is 0.0689 days, which agrees with the GCVS to within 5.5 percent.
 Color curve for DY Peg
These curves are similar to ones found in the literature. The V light curve in Geyer and Hoffman 1975 and the V light curve in Iriarte 1952 have similar periods and changes in magnitude.
 Geyer and Hoffman DY Peg
light curve
Geyer and Hoffman DY Peg
light curve
 Iriarte DY Peg light curve
References
- Geyer, E.H., and M. Hoffman. "A Two-Colour Photometry of the Short Period RR Lyrae Star DY Peg." Astronomy and Astrophysics Supplement Series. vol. 21, p.183-188. 1975 August.
- Iriarte, Braulio. "A Photoelectric Light-Curve of DY Peg." Astrophysical Journal. vol. 116, p.382. 1952 September.
HX Lac
Shown below is the light curve for HX Lac and the two comparison stars. Magnitude is given in instrumental magnitudes and time is the Universal Time on October 3, 2001 given in hours.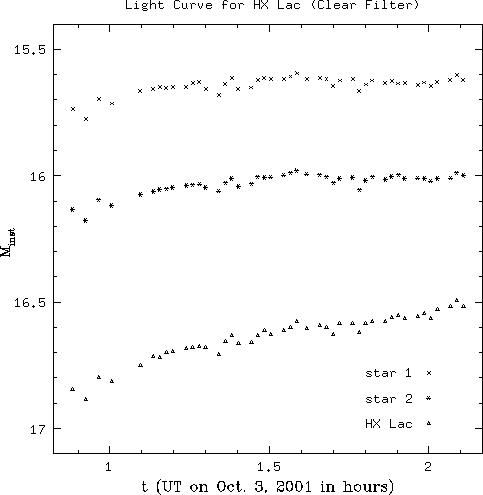 Light Curve of HX LAC and comparison stars
A general trend can be seen in all three curves which corresponds to the atmospheric fluctuations which occured throughout the observing period. Yet HX Lac varies slightly more than the two comparison stars (approximately 0.4 magnitudes over the course of the observations). This can be seen more clearly in the plot of the relative magnitude of HX Lac where atmospheric fluctuations have been removed.
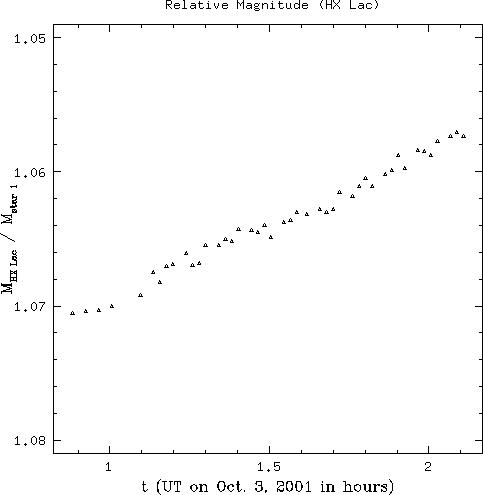 Relative Magnitude of HX Lac
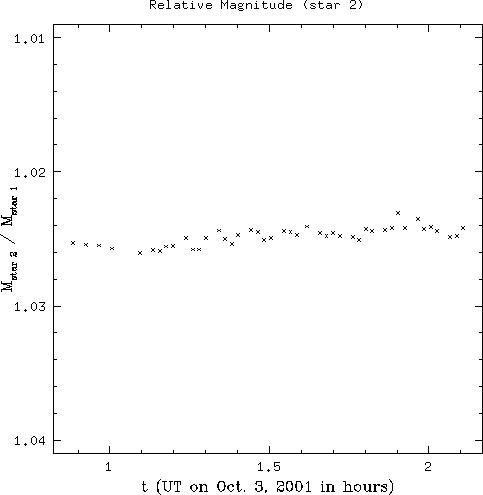
In this plot HX Lac is clearly seen to vary with respect to star 1. On the other hand in the plot of the relative magnitude of star 2, that star is shown to remain constant with respect to star 1.
 Relative Magnitude of star
2
Relative Magnitude of star
2This demonstrates that HX Lac is indeed varying with respect to the background stars. However, we do not see the light curve expected for an eclipsing system. Most likely the light curve obtained here represents the tail end of the eclipse, as the star is climbing in magnitude. Evidently, we failed to observe the star at the beginning of the eclispe.
NGC 7789
The completed mosaic images are shown here (click thumbnails for larger images):
 R-band mosaic of NGC7789.
 V-band mosaic of NGC7789.
Even a cursory examination of these images reveals the poor quality of data available. The inability to dark subtract has left CCD irregularities and cosmic rays prominent on both mosaics, and the poor flat-fielding is evident in the artificial brightness gradients within and across quadrants of the mosaics. However, despite these troubling irregularities, the resulting color-magnitude diagram is surprisingly accurate. For comparison, several CM diagrams of this cluster from the literature are shown. The first major NGC7789 C-M diagram was done by Burbidge and Sandage in 1958 (ApJ vol. 128, p.174). This early CM diagram shows a strong Red Giant Branch, a distinct Red Clump and some evidence of Blue stragglers; all of which are also apparent in our CM diagram. These key features are seen again in the more complete CM diagram of Gim et al (1998).
The severe imperfections in the data used to prepare this CM diagram prohibit us from making any defensible arguments about the age, history or structure of the cluster NGC7789. However, the apparent presence in our CMD of several key features found in previous CMDs means that our results do not recommend any major reassessments of this cluster's properties.
 1958 CM Diagram of NGC7789 by Burbidge and Sandage.
 1998 CM Diagram of NGC7789 by Gim et al.
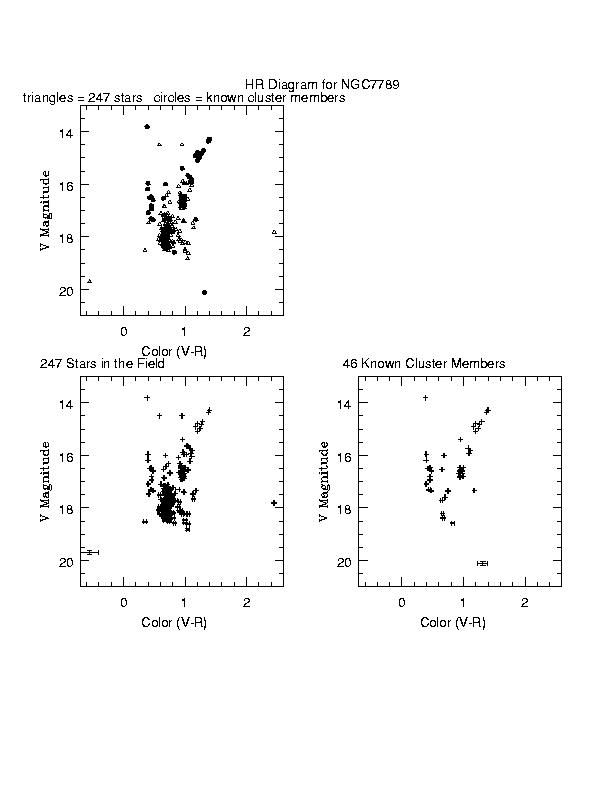 2001 CM Diagrams of NGC7789 by Kepley, Ritchey, and Rodney.
References
- Gim, Munhwan; Hesser, James E.; McClure, Robert D.,; Stetson, Peter B. "The Open Cluster NGC 7789. I. Radial Velocities for Giant Stars." Publications of the Astronomical Society of the Pacific, vol. 110, p.1172-1182, 1998 October
- Burbidge, E.M.; Sandage, A. "The Color-Magnitude Diagram for the Galactic NGC 7789." Astrophysical Journal, vol. 128, p.174, 1958 September
M27 (Dumbbell Nebula)
Below is the the final color-combined image of M27, the Dumbbell Nebula.
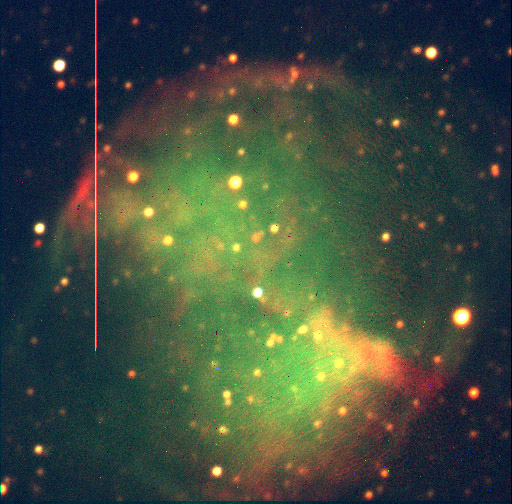 Color-combined image of M27
The luminosity of a planetary nebula comes from the downward transition of electrons excited by the ultraviolet photons emitted from the white dwarf progenitor. The blue and green filters picked up the forbidden [O III] lines, while the red filter picked up the ionized hydrogen and nitrogen.
References
- Carroll, Bradley and Dale A. Ostlie. An Introduction to Modern Astrophysics. Reading, Massachusetts: Addison-Wesley, 1996, pg. 507.
Warner and Swasey Observatory / Case Western Reserve University / © 2001 / Last Updated Wednesday, December 5, 2001.