| Warner and Swasey Observatory |
| Case Western Reserve University | Nassau Station |
| Visitors |
|
» Home » News » Gallery » Reference » Weather |
| Science Resources |
|
» NSRT User Interface » Software » Data Archive » Download Data |

|
 |
Bench Spectrograph on the Nassau Robotic Telescope sees first light!
For more information on spectrographs and spectra go here.
For more information on fiber optics go here.
What is "first light"? For those not familiar with the lingo of the astronomical community, first light is the event where the instrument/telescope combination is used to record its first images. In reality, it is not quite the gala event you might imagine as it normally occurs late one night whilst the sleep deprived astronomers and technicians struggle to stay awake and keep their new setup from falling to pieces.
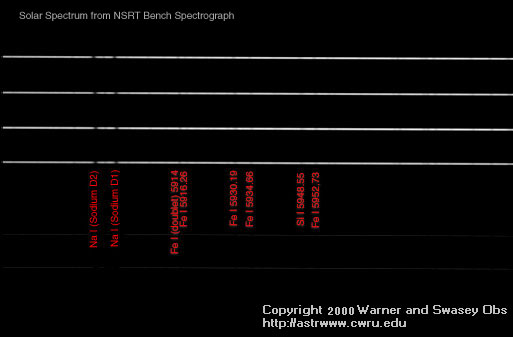
The first spectrum we took with the NSRT bench spectrograph is of a source familiar to us all, our own Sun. We did not point the telescope at the sun but simply opened the dome slit on a partly cloudy day and let scattered light from the sky focus on the fiber heads. The eight optical fibers carried the light to the spectrograph where it was split up into the spectra you see here. In this image the light from only four of the eight fiber spectra are visible because of image contrasting. The other four are fainter and not visible because they are fibers with smaller diameters (see the reference on fiber optics).
This image was made with the high dispersion grating (1200 lines/inch) which gives about 150 angstroms of spectra from left to right on the CCD chip. The spectra we took were centered at about 5900 angstroms (near the Fraunhofer Sodium D spectral lines). The spectral lines are places where atoms in the Sun's atmosphere have absorbed some of the light so they appear slightly darker than the rest of the spectrum. We have labeled some of the lines in red with their wavelength in angstroms.

Above is an intensity plot of the spectra from the third fiber head from the top in the first-light image. Here you can more easily see the spectral lines where light has been absorbed from the spectrum. Normally when we look at spectra to do science, we plot them like this.
For more information on spectrographs and spectra go here.
For more information on fiber optics go here.
Back to the gallery index
©2000 CWRU Astronomy Dept.
comments
Last modified December 12, 2000
Case Western Reserve University